- Published on
- Exercise 5
Understanding cluster compliance
- Authors
- Name
The first two days of the consulting engagement at ACME have whirled by. You're working remotely today for day three and are pairing up with Melissa from the banks compliance squad.
On the agenda today is to harden the prd-acme-hub cluster by understanding and remediating compliance against the NIST 800-53 moderate benchmark.
The bank must comply with this specific benchmark to meet the requirements of their regulation legislation known as APRA (ACME Penny Regulation Act, 1998).

5.1 - Installing the compliance operator
You’re got an upcoming Microsoft Skype for Business™ video call with Melissa in 30 minutes to show her how compliant the cluster is currently.
Time to quickly get the OpenShift Compliance Operator installed and run a scan via Red Hat Advanced Cluster Security. Better hurry!
As with last time, to limit PTSD induced panic attacks among the ACME platform team the operator must be set to update mode Manual.
Documentation you may find helpful is:
- https://docs.redhat.com/en/documentation/openshift_container_platform/4.17/html/security_and_compliance/compliance-operator#installing-compliance-operator-web-console_compliance-operator-installation
5.2 - Scheduling a compliance scan
Operator installed it's time to join the virtual meeting with Melissa and step her through how to run a compliance scan against NIST 800-53 moderate and visualise results using the Red Hat Advanced Cluster Security Dashboard.
Create a new scan schedule named prd-acme-hub-nist-daily targeting the appropriate benchmarks.
| |
|:-----------------------------------------------------------------------------:|
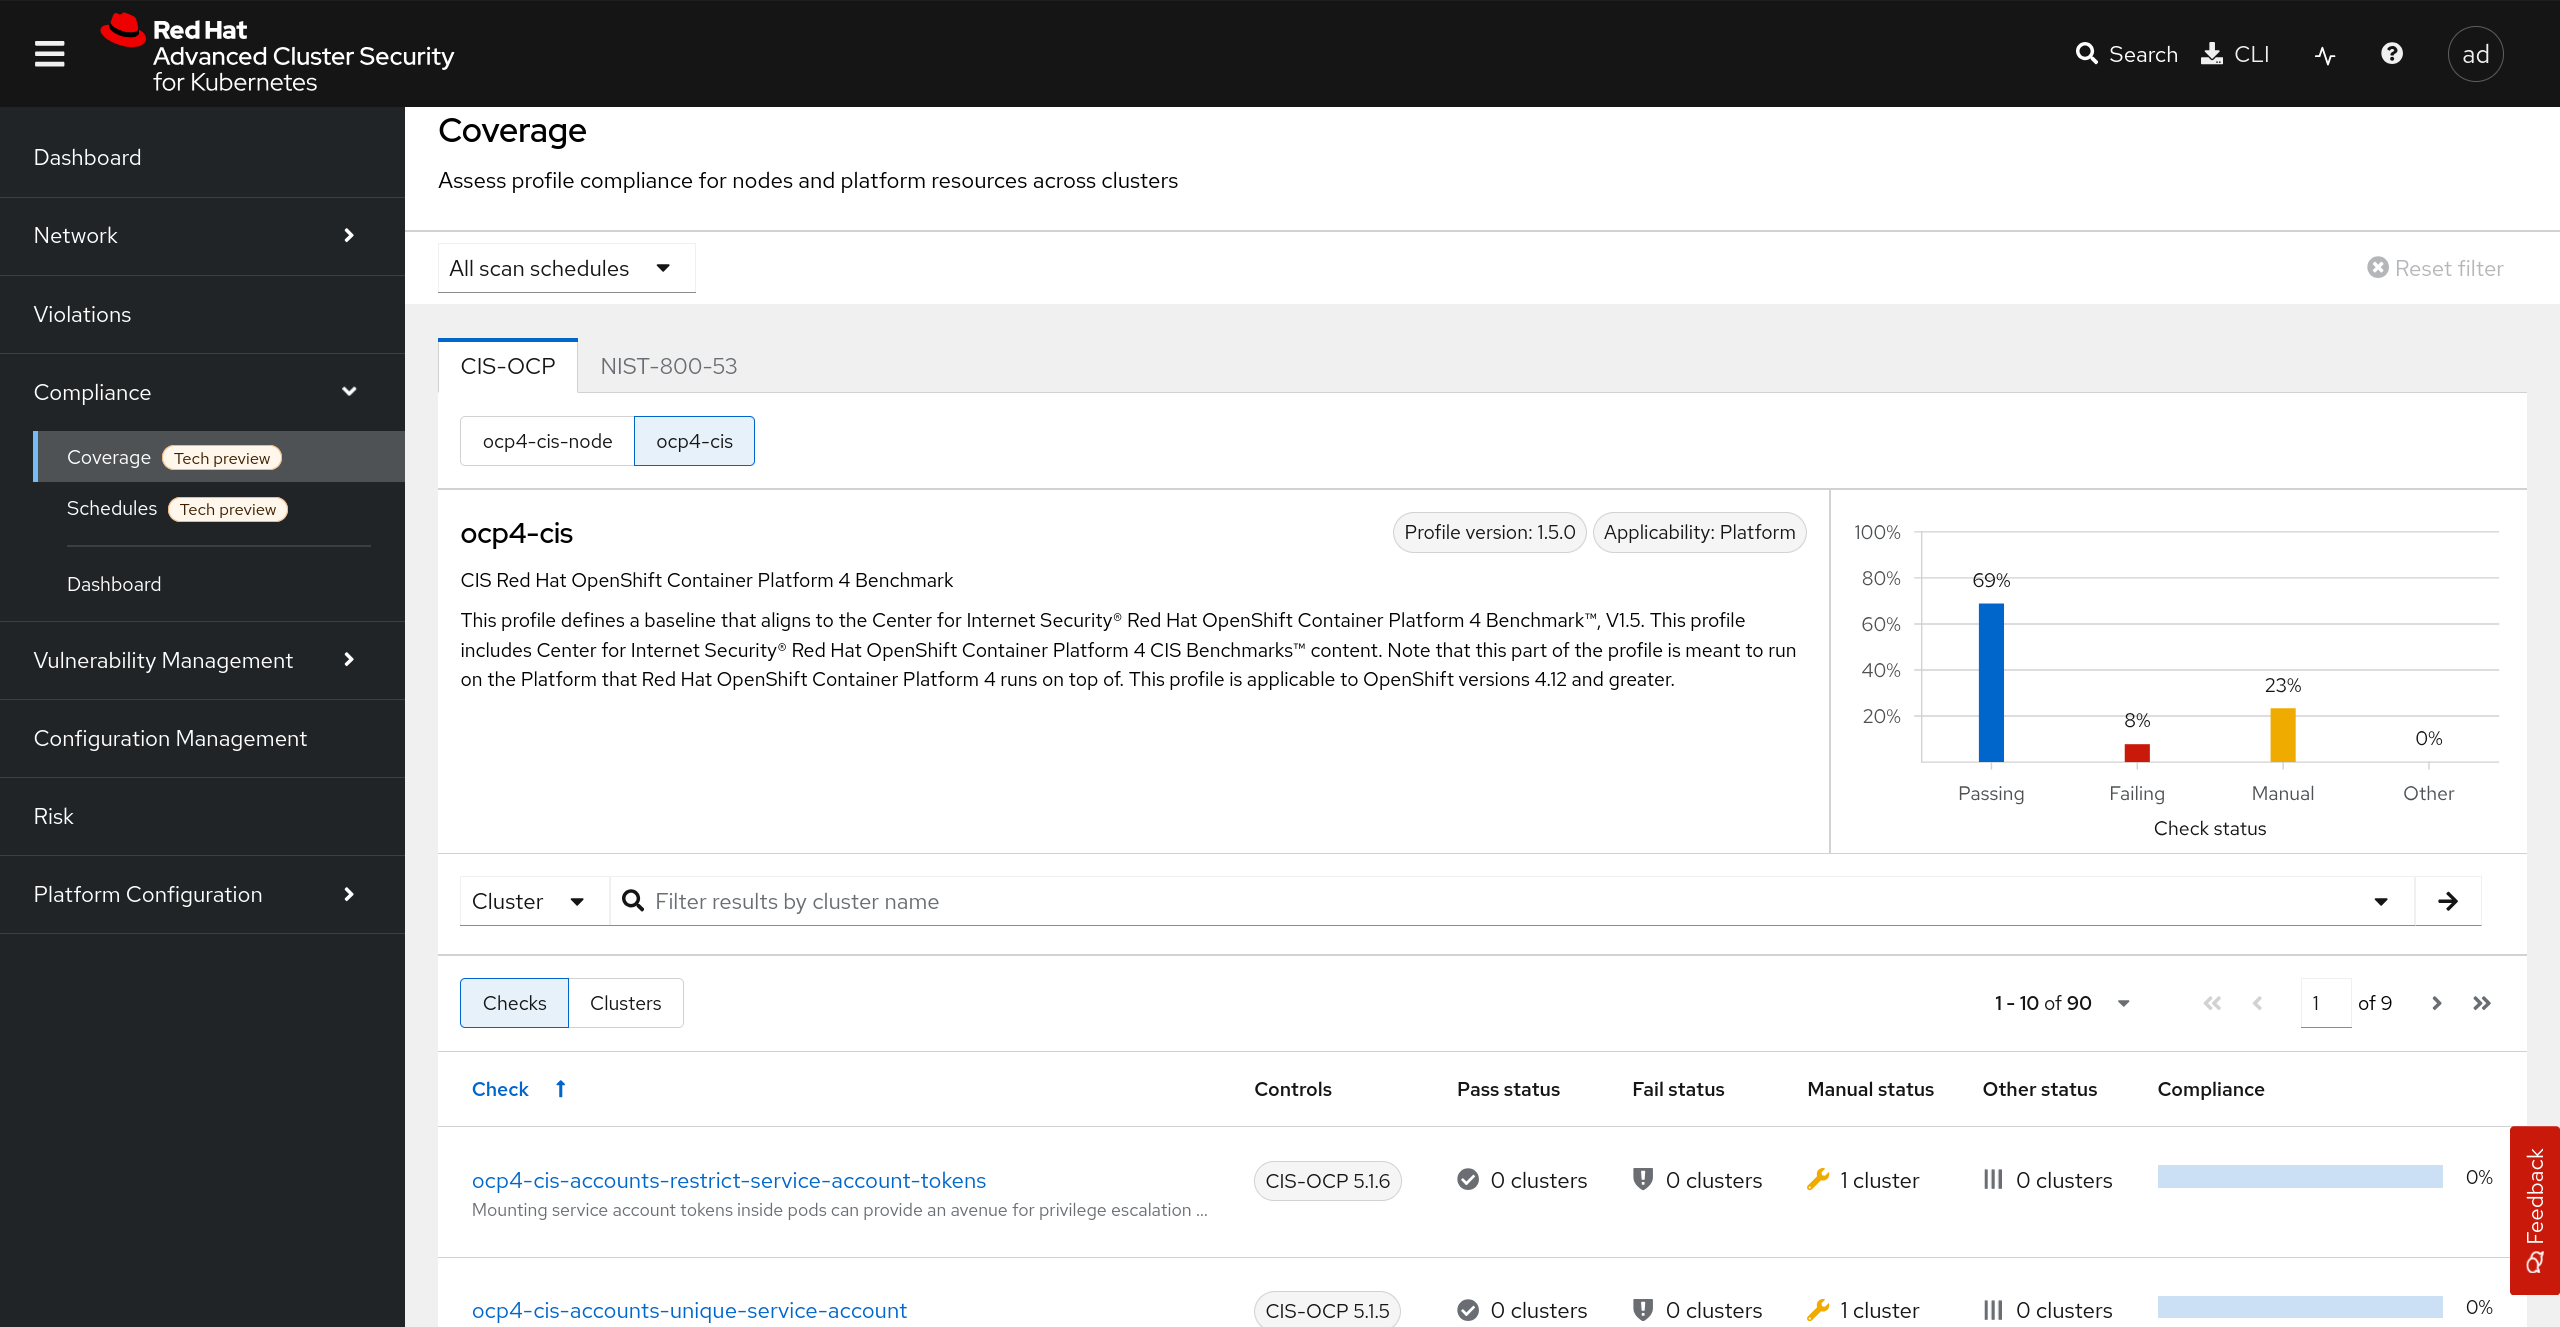
| Viewing a compliance report in Red Hat Advanced Cluster Security |
|
|:-----------------------------------------------------------------------------:|
| Viewing a compliance report in Red Hat Advanced Cluster Security |
Documentation you may find helpful is:
- https://docs.redhat.com/en/documentation/red_hat_advanced_cluster_security_for_kubernetes/4.5/html/operating/managing-compliance#scheduling-compliance-scans-and-assessing-profile-compliance
5.3 - Remediating a compliance issue
Scan finished you begin stepping through Melissa the individual results, inspecting ComplianceCheckResult and ComplianceRemediation resources.
To demonstrate to her how the compliance operator can make automated remediation of compliance issues easy you pick out the ocp4-moderate-oauth-or-oauthclient-token-maxage compliance remediation and apply it, then trigger a re-scan from the compliance operator to validate this issue is now remediated on the cluster.
Documentation you may find helpful is:
- https://docs.openshift.com/container-platform/4.17//security/compliance_operator/co-scans/compliance-operator-remediation.html#compliance-applying_compliance-remediation
5.4 - Check your work
If you've successfully run the compliance scan and remediated the compliance issue to show Melissa how things work please post in #event-anz-ocp-security-hackathon with the message:
Please review [team name] solution for exercise 5, our cluster is now [percentage] compliant against NIST 800-53 moderate at a cluster level.
This exercise is worth 25 points. The event team will reply in slack to confirm your updated team total score 🎉